통계 Open API
Open API 사용방법
1. 사용 할 Open API 정하기
Open API 목록 메뉴의 서비스 항목을 확인합니다.
2. 명세서를 다운로드 받습니다.
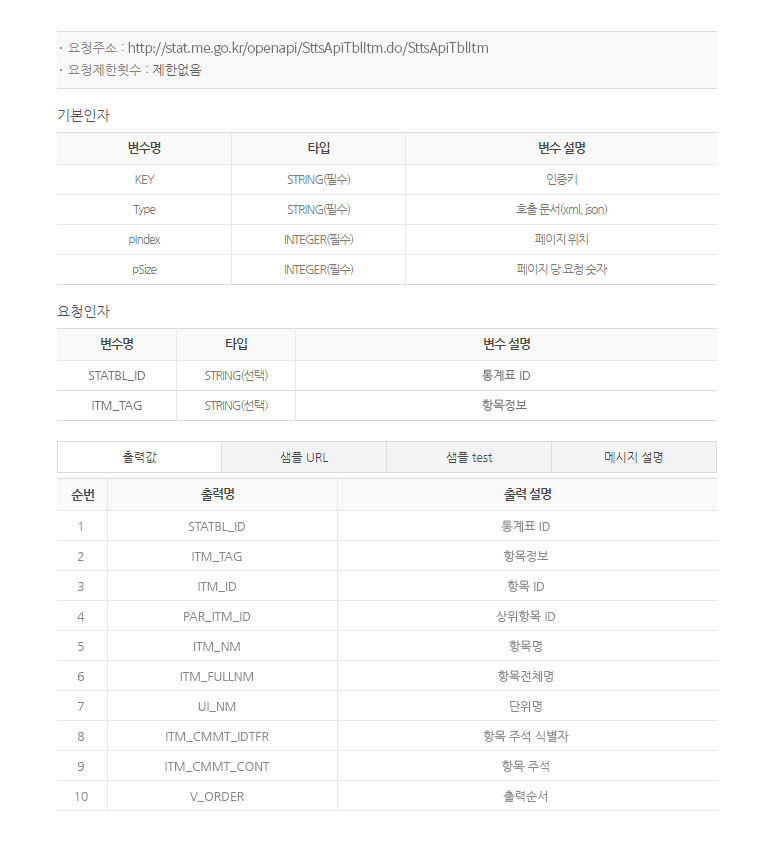
명세서에는 Open API를 사용하기 위한 설명이 포함되어 있습니다.

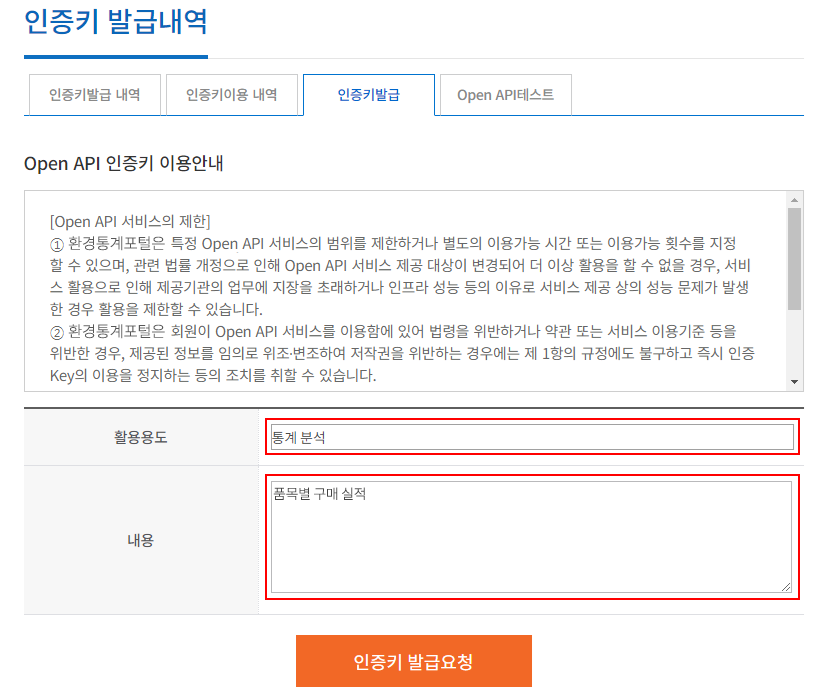
3. 인증키 발급
통계포털에서 제공하는 Open API는 RESTful 방식의 웹서비스 입니다. RESTful 웹서비스는 HTTP를 사용하는 웹기반 인터페이스로 GET 또는 POST 방식의 URI를 통해 서비스 되기에 파라미터의 값을 URL에 표기하여 페이지를 로딩합니다.
인증키를 발급 받기 위해서는 로그인을 하셔야 합니다.

4. URL 등록
통계포털에서 제공하는 Open API는 RESTful 방식의 웹서비스 입니다. RESTful 웹서비스는 HTTP를 사용하는 웹기반 인터페이스로 GET 또는 POST 방식의 URI를 통해 서비스 되기에 파라미터의 값을 URL에 표기하여 페이지를 로딩합니다.
인증키를 발급 받기 위해서는 로그인을 하셔야 합니다.

- ① Open API URL 통계포털의 Open API 주소는 https://stat.me.go.kr/openapi/ 입니다.
- ② Open API 명 통계포털의 Open API 서비스는 고유명을 가지고 있습니다. 다운로드 받으신 명세표에 요청 주소가 표기되어 있습니다.
- ③ 기본인자 기본인자를 생략하면 명세표의 기본값으로 결과를 표기합니다. 인증키(KEY)는 발급을 받으신 후 발급 받은 인증키를 추가하여야 합니다. 만약 인증키가 없다면 기본값은 sample로 처리되어 10건 만 출력되므로 반드시 인증키를 입력하셔야 합니다. 호출문서(Type)은 xml 이나 json 등 출력하고자 하는 타입의 형태를 지정합니다. 기본값은 xml입니다. 페이지 위치(pIndex)는 출력하고자 하는 페이지 입니다. 데이터 수가 많은 경우에는 페이지 위치를 증가시키면서 여러 번에 나누어 호출하셔야 합니다. 페이지당 요청숫자(pSize)는 한 페이지에 출력될 건수입니다.
- ④ 요청인자 통계포털의 각 서비스 별로 별도로 지정한 인자 값 입니다. 이 요청인자는 요청인자가 제공되는 서비스만 가능합니다.
5. APP에서 Open API 요청
이제 Open API를 활용하여 새로운 App을 개발하였습니다. 개발 된 App에서 요청한 데이터가 여러분께서 만든 앱의 내용에 표시됩니다.

개발소스예제
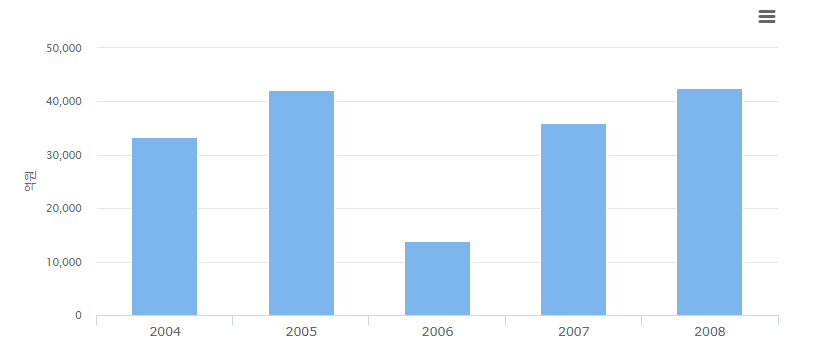
막대그래프형 소스보기
<script src="https://code.jquery.com/jquery-1.12.4.min.js" integrity="sha256-ZosEbRLbNQzLpnKIkEdrPv7lOy9C27hHQ+Xp8a4MxAQ=" crossorigin="anonymous"></script>
<script type="text/javascript" src="https://code.highcharts.com/highcharts.js" /></script>
<script type="text/javascript" src="https://code.highcharts.com/modules/exporting.js" /></script>
<script type="text/javascript">
	$.ajaxPrefilter('json', function(options, orig, jqXHR){
		return 'jsonp';
	});
	$.ajax({
		url         : 'https://stat.me.go.kr/openapi/Sttsapitbldata.do?STATBL_ID=T213003007558461&DTACYCLE_CD=YY&Type=json',
		type        : 'GET',
		dataType    : 'json',
		success     : function (result) {
			drawBarChart(result);
			drawPieChart(result);
			drawGrid(result);

		},
		error       : function (result) {
		}
	});

	function drawBarChart(jsonData) {
		var rows = jsonData.SttsApiTblData[1].row;
		if(rows) {
			var representativeRow = rows[0],
				statNm = representativeRow.STATBL_ID,
				itemNm1 = representativeRow.ITM_NM,
				uiNm = representativeRow.UI_NM;

			var dataArray = [];
			$.each(rows, function(idx, row) {
				var tmp = [];
				tmp.push(row.WRTTIME_IDTFR_ID);
				tmp.push(Number(row.DTA_VAL));
				dataArray.push(tmp);
			});

			$('#barChart').highcharts({
				chart: {
					type: 'column'
				},
		        credits: {
		            enabled: false
		        },
				title: {
					text: ''
				},
				xAxis: {
					type: 'category',
					labels: {
						style: {
							fontSize: '13px',
							fontFamily: 'Verdana, sans-serif'
						}
					}
				},
				yAxis: {
					min: 0,
					title: {
						text: uiNm
					},
					 labels: {
					    	formatter: function(){
					    		return commaWon(this.value);
					    	}
					    }
				},
				tooltip: {
					pointFormat: '{point.y}'+uiNm
				},
				series: [{
					name: itemNm1,
					data: dataArray
				}]
			});
		}
	}
</script>

<div id="barChart" style="min-width:300px;height:400px;margin:0 auto;"></div>
원그래프형 소스보기
<script src="https://code.jquery.com/jquery-1.12.4.min.js" integrity="sha256-ZosEbRLbNQzLpnKIkEdrPv7lOy9C27hHQ+Xp8a4MxAQ=" crossorigin="anonymous"></script>
<script type="text/javascript" src="https://code.highcharts.com/highcharts.js" /></script>
<script type="text/javascript" src="https://code.highcharts.com/modules/exporting.js" /></script>
<script type="text/javascript">
	$.ajaxPrefilter('json', function(options, orig, jqXHR){
		return 'jsonp';
	});
	$.ajax({
		url         : 'https://stat.me.go.kr/openapi/Sttsapitbldata.do?STATBL_ID=T213003007558461&DTACYCLE_CD=YY&Type=json',
		type        : 'GET',
		dataType    : 'json',
		success     : function (result) {
			drawBarChart(result);
			drawPieChart(result);
			drawGrid(result);

		},
		error       : function (result) {
		}
	});

	function drawPieChart(jsonData) {
		var rows = jsonData.SttsApiTblData[1].row;
		if(rows) {
			var representativeRow = rows[0], statNm = representativeRow.STATBL_ID,
				itemNm1 = representativeRow.ITM_NM,
				uiNm = representativeRow.UI_NM;

			var dataArray = [];
			$.each(rows, function(idx, row) {
				var tmp = [];
				tmp.push(row.WRTTIME_IDTFR_ID);
				tmp.push(Number(row.DTA_VAL));
				dataArray.push(tmp);
			});

			$('#pieChart').highcharts({
		        credits: {
		            enabled: false
		        },
				chart: {
	                plotBackgroundColor: null,
	                plotBorderWidth: null,
	                plotShadow: false,
	                type: 'pie'
	            },
	            title: {
	                text: ''
	            },
	            tooltip: {
	                pointFormat: '{point.percentage:.1f}%'
	            },
	            plotOptions: {
	                pie: {
	                    allowPointSelect: true,
	                    cursor: 'pointer',
	                    dataLabels: {
	                        enabled: false
	                    },
	                    showInLegend: true
	                }
	            },
	            series: [{
	                colorByPoint: true,
	                data: dataArray
	            }]
			});
		}
}
</script>

<div id="pieChart" style="min-width:300px;height:400px;margin:0 auto;"></div>
텍스트형 소스보기
| 항목 | 대기오염도 |
|---|
<script src="https://code.jquery.com/jquery-1.12.4.min.js" integrity="sha256-ZosEbRLbNQzLpnKIkEdrPv7lOy9C27hHQ+Xp8a4MxAQ=" crossorigin="anonymous"></script>
<script type="text/javascript">
	$.ajaxPrefilter('json', function(options, orig, jqXHR){
		return 'jsonp';
	});
	$.ajax({
		url         : 'https://stat.me.go.kr/openapi/Sttsapitbldata.do?STATBL_ID=T213003007558461&DTACYCLE_CD=YY&Type=json',
		type        : 'GET',
		dataType    : 'json',
		success     : function (result) {
			drawBarChart(result);
			drawPieChart(result);
			drawGrid(result);

		},
		error       : function (result) {
		}
	});

	function drawGrid(jsonData) {
		var rows = jsonData.ArcData.row;	// ArcData위치에 해당하는 변수명은 각 API마다 url의 Service명과 동일하게 변합니다.
		if(rows) {
			var html = '';
			$.each(rows, function(idx, row) {
				html += '<tr>';
				html += '	<td style="border: 2px solid gray; text-align: center;">' + row.ITEM_NAME2 + '</td>';
				html += '	<td style="border: 2px solid gray; text-align: center;">' + row.DATA_VALUE + '</td>';
				html += '</tr>';
			});
			$('#grid').append(html);
		}
	}
</script>

<table style="border: 2px solid gray; width: 700px; text-align: center;">
	<colgroup>
		<col width="50%">
		<col width="">
	</colgroup>
	<thead>
		<tr>
			<th style="border: 2px solid gray; text-align: center;">지역</th>
			<th style="border: 2px solid gray; text-align: center;">부담지수</th>
		</tr>
	</thead>
	<tbody id="grid">
	</tbody>
</table>
언어별 개발가이드
JAVA 개발 메뉴얼
0. 환경
- Eclipse EE Luna(v4.4.2) or Latest version
- Tomcat7
1. 프로젝트 생성
-
Eclipse 실행 후 File > New > Project를 선택하여 프로젝트를 생성합니다.

-
Dynamic Web Project를 선택합니다.

-
Project name을 입력하고 Finish를 눌러 마칩니다.

2. jsp 코딩
-
생성한 프로젝트의 WebContents 폴더하위에 sample.jsp 생성합니다.

-
sample.jsp를 다음과 같이 코딩합니다.

-
stringUrl에 사용할 API주소를 입력합니다.
source code
   <%@ page language="java" contentType="text/html; charset=UTF-8" pageEncoding="UTF-8"%>
	   <%@ page import="java.io.*" %>
	   <%@ page import="java.net.*" %>
	   <%@ page import="javax.xml.*" %>
	   <%@ page import="javax.xml.parsers.*" %>
	   <%@ page import="org.w3c.dom.*" %>
	   <%
	   	URL url = null;
	   	URLConnection urlConnection = null;

	   	String stringUrl = "https://stat.me.go.kr/openapi/Sttsapitbldata.do?STATBL_ID=T213003007558461&DTACYCLE_CD=YY&Type=json";
	   	InputStream is = null;
	   	String data = "";

	   	try {

	   		url = new URL(stringUrl);
	   		urlConnection = url.openConnection();
	   		urlConnection.setDoOutput(true);

	   		is = urlConnection.getInputStream();

	   	 	byte[] buf = new byte[2048];
	   	 	int len = -1;
	   	 	StringBuffer sb = new StringBuffer();

	   	 	while ((len = is.read(buf, 0, buf.length)) != -1) {
	   	 		sb.append(new String(buf, 0, len));
	   	 	}

	   	 	data = sb.toString();

	   	} catch (MalformedURLException e) {
	   		e.getMessage();
	   	} catch (IOException e) {
	   		e.getMessage();
	   	} finally {
	   		if (is != null) {
	   			is.close();
	   		}
	   	}
	   %>
	   <!DOCTYPE html>
	   <html>
	   <head>
	   	<meta http-equiv="Content-Type" content="text/html; charset=UTF-8">
	   	<title>Insert title here</title>
	   </head>
	   <body>
	   	java sample page
	   	<%=data%>;
	   </body>
	   </html>
3. 배포
-
File > New > Other를 선택하여 서버를 생성합니다.

-
server를 선택하고 다음단계로 넘어갑니다.

-
Tomcat v7.0 Server를 선택하고 다음단계로 넘어갑니다.

-
Available영역에 있는 프로젝트를 선택하고 Add를 눌러 Configured영역으로 이동시킵니다.

-
Servers 탭에 새로운 서버가 생성되었습니다.

-
생성한 서버를 더블클릭하여 설정화면으로 들어갑니다. 아래에서 Modules탭을 선택합니다. 대상을 선택하고 Edit버튼을 클릭합니다.

-
Path에 "/"를 입력합니다.

-
Servers에서 서버를 선택하고 마우스우클릭 > Start로 실행시킵니다.

4. 확인
-
브라우저 주소창에 http://localhost:8080/sample.jsp를 입력하고 결과를 확인합니다.

PHP 개발 메뉴얼
0. 환경
- PHP5
- Apache
1. php 코딩
-
Apache에 설정된 DucumentRoot 폴더에 sample.php를 생성합니다.

-
sample.php를 다음과 같이 코딩합니다.

-
$URL에 사용할 API주소를 입력합니다.
source code
<?php
        $URL = "https://stat.me.go.kr/openapi/Sttsapitbldata.do?STATBL_ID=T213003007558461&DTACYCLE_CD=YY&Type=json";
        $response = file_get_contents($URL);
?>
<!DOCTYPE html>
<html>
<head>
<meta http-equiv="Content-Type" content="text/html; charset=UTF-8">
<title>Insert title here</title>
</head>
<body>
        <p>php sample page</p>
        <?php echo($response);?>
</body>
</html>
2. 확인
-
브라우저 주소창에 http://localhost/sample.php를 입력하고 결과를 확인합니다.

.NET 개발 메뉴얼
0. 환경
- Visual Studio Express 2015 for Web
1. 프로젝트 생성
-
Visual Studio 실행 후 파일 > 새 웹 사이트를 선택하여 프로젝트를 생성합니다.

-
템플릿에서 C#을 선택 후, ASP.NET 빈 웹 사이트를 선택하고 확인을 누릅니다.

-
솔루션 탐색에 추가된 프로젝에서 마우스우클릭 > 추가 > 웹 폼을 선택합니다.

-
이름은 Default로 입력하고 확인을 누릅니다.

-
Default.aspx를 다음과 같이 코딩합니다.

source code
<%@ Page Language="C#" AutoEventWireup="true" CodeFile="Default.aspx.cs" Inherits="_Default" %> <!DOCTYPE html> <html xmlns="http://www.w3.org/1999/xhtml"> <head runat="server"> <meta http-equiv="Content-Type" content="text/html; charset=utf-8"/> <title></title> </head> <body> <form id="form1" runat="server"> asp.net sample page <%=xmlData%>; </form> </body> </html> -
에디터영역에서 마우스우클릭 > 코드보기를 선택합니다.

-
Default.aspx.cs를 다음과 같이 코딩합니다.

-
stringUrl에 사용할 API주소를 입력합니다.
source code
using System;
using System.Collections.Generic;
using System.Linq;
using System.Web;
using System.Web.UI;
using System.Web.UI.WebControls;
using System.Net;
using System.IO;
public partial class _Default : System.Web.UI.Page
{
    public String xmlData;
    protected void Page_Load(object sender, EventArgs e)
    {
        String stringUrl = "https://stat.me.go.kr/openapi/Sttsapitbldata.do?STATBL_ID=T213003007558461&DTACYCLE_CD=YY&Type=json";
        WebRequest request = HttpWebRequest.Create(stringUrl);
        WebResponse response = request.GetResponse();
        StreamReader reader = new StreamReader(response.GetResponseStream());
        String result = reader.ReadToEnd();
        xmlData = result.ToString();
    }
}
2. 확인
-
솔루션 탐색기에서 프로젝트를 선택하고 마우스우클릭 > 브라우저에서 보기를 눌러 결과를 확인합니다.


PERL 개발 메뉴얼
0. 환경
- Apache
1. perl 코딩
-
cgi-bin 폴더에 sample.cgi를 생성합니다.

-
sample.cgi를 다음과 같이 코딩합니다.

-
$URL에 사용할 API주소를 입력합니다.
source code
#!/usr/bin/perl
use LWP::Simple;
$contents = get('https://stat.me.go.kr/openapi/Sttsapitbldata.do?STATBL_ID=T213003007558461&DTACYCLE_CD=YY&Type=json');
print "Content-type: text/html";
print "<!DOCTYPE html>"; print "<html>"; print "<head>"; print "<title>perl sample≶/title>"; print "<meta charset=\"utf-8\"/>"; print "</head>"; print "<body>"; print $contents print "</body>"; print "</html>";
2. 확인
-
브라우저 주소창에 http://localhost/sample.php를 입력하고 결과를 확인합니다.

EXCEL 개발 메뉴얼
0. 환경
- Microsoft Excel 2010 or Latest version
1. Excel 환경설정
-
Microsoft Excel 2010 실행 후 파일 > 옵션을 선택합니다.

-
리본 사용자 지정을 선택하고 오른쪽에 개발 도구에 체크를 합니다.

2. Visual Basic 코딩
-
메뉴에 개발 도구 항목을 선택한 후 Visual Basic을 누릅니다.


-
메뉴에서 삽입 > 모듈을 선택합니다.


-
메뉴에서 도구 > 참조를 선택합니다.

-
Microsoft WinHTTP Services, version 5.1과 Microsoft XML v6.0을 찾아서 체크합니다.

-
다음과 같이 코딩합니다.

-
callUrl에 사용할 API주소를 입력합니다.
source code
Sub callOpenapi()

    Dim callUrl As String
    Dim result As String
    Dim objHttp As New WinHttpRequest

    Dim nodeList As IXMLDOMNodeList
    Dim nodeRow As IXMLDOMNode
    Dim nodeCell As IXMLDOMNode

    Dim rowCount As Integer
    Dim cellCount As Integer
    Dim rowRange As Range
    Dim cellRange As Range
    Dim sheet As Worksheet

    callUrl = "https://stat.me.go.kr/openapi/Sttsapitbldata.do?STATBL_ID=T213003007558461&DTACYCLE_CD=YY&Type=json"
    objHttp.Open "GET", callUrl, False
    objHttp.Send

    If objHttp.Status = 200 Then
        result = objHttp.ResponseText

        Dim objXml As MSXML2.DOMDocument
        Set objXml = New DOMDocument
        objXml.LoadXML (result)

        Set sheet = ActiveSheet
        Set nodeList = objXml.SelectNodes("/SttsApiTblData/row")

        rowCount = 0
        For Each nodeRow In nodeList
            rowCount = rowCount + 1
            cellCount = 0
            For Each nodeCell In nodeRow.ChildNodes
                cellCount = cellCount + 1
                Set cellRange = sheet.Cells(rowCount, cellCount)
                cellRange.Value = nodeCell.Text
            Next nodeCell
        Next nodeRow
    End If
End Sub
3. 실행
-
메뉴에서 매크로를 실행합니다.

4. 확인
-
엑셀문서를 확인합니다.

